Every online parcel has a tracking page that shows its status, such as packed, shipped, or out for delivery. If a parcel gets delayed, you can check where it got stuck. Now imagine an AI agent without a tracking system. It completes a task, makes several decisions, and gives an answer. If the answer is wrong, it can be difficult to find out what went wrong.
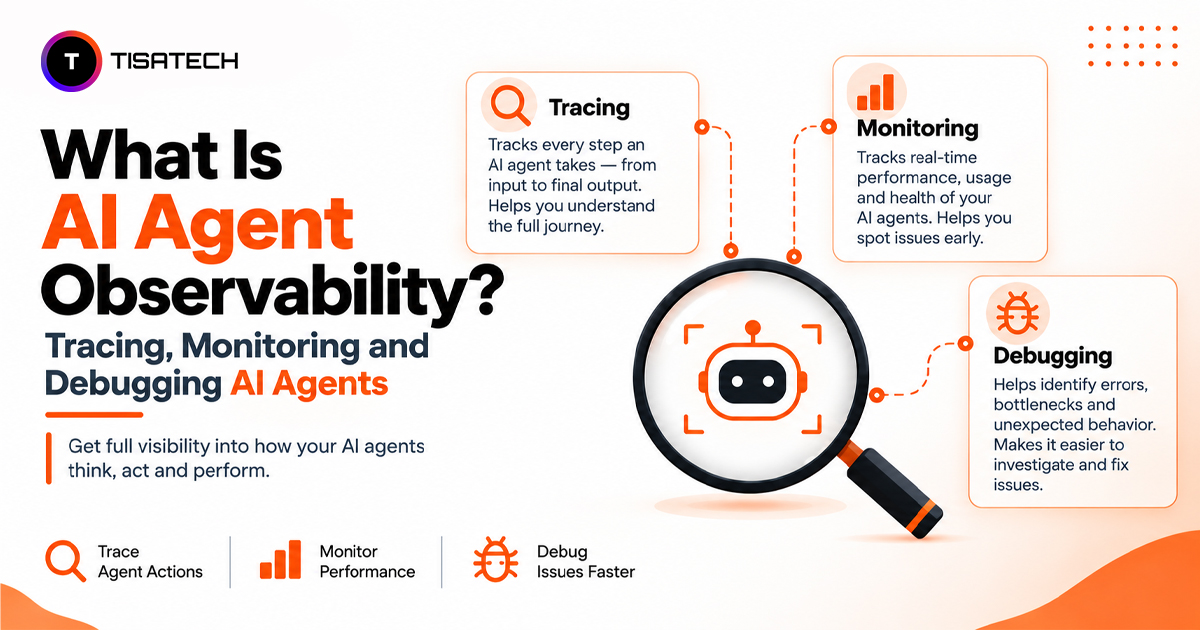
AI agent observability helps solve this problem. It records model calls, tool usage, and the information an agent retrieves. Developers can use these details to understand how the agent works and find errors. For students learning Generative AI, AI agent observability is a practical way to understand what happens inside an AI application. It helps beginners track model calls, check tool outputs, find coding or data retrieval errors, and test fixes while building their own AI agent projects.
This visibility is important beyond student projects, too. According to Splunk’s 2026 State of Observability report, 85% of respondents said it was important to identify when AI produces incorrect information, but only 58% said their organizations could do this effectively.

What Is AI Agent Observability?
AI agent observability means tracking the steps an AI agent takes while completing a task. For students building their first AI agent, this includes checking model responses, tool calls, retrieved information, and errors during execution. When a task goes wrong, the record shows what happened and why.
Three practices work together to improve an AI agent. Tracing records the sequence of model calls, tool executions, and other operations during a task. Monitoring tracks patterns across many runs, such as latency, error rates, and cost per task. Evaluation checks whether the agent’s outputs and actions meet defined quality and task-success criteria.
OpenTelemetry provides a standard way to record traces across different observability tools. Its trace documentation explains how individual operations connect into one execution path. This helps developers track agent steps and investigate failures across tools.
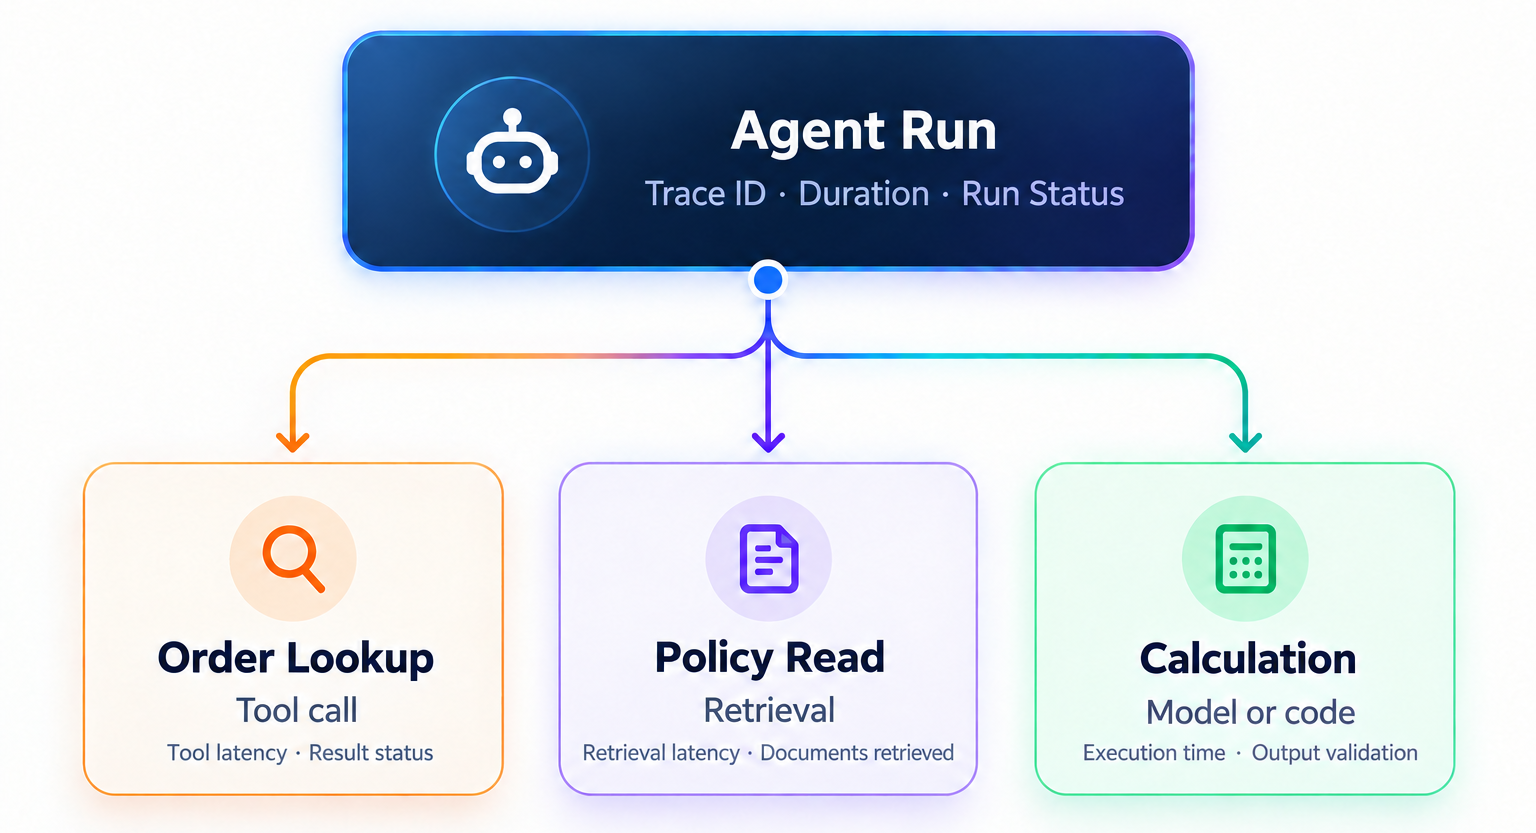
A span is one timed step inside a trace, like one model call or one tool run.
For example, a refund agent’s trace can contain separate spans for the order lookup, policy retrieval, and refund calculation. Each span records relevant execution details, such as duration and status. If the refund is incorrect, developers can inspect these spans to find where the wrong data or decision first appeared.
Why Do AI Agents Need Tracing?
A normal program follows fixed steps. The same input takes the same path every time. An agent works differently. It makes a plan on the spot, picks a tool, reads the result, and decides the next move. Two runs of the same prompt can take two different routes.
That makes the final answer a poor clue when you test an AI agent project. A wrong reply might come from an incorrect plan, outdated information, a slow API, or a failed tool call. Inspecting the trace helps you find the step that caused the problem instead of changing code without knowing what went wrong.
Tracing can also reveal failures that basic health checks miss. A tool may return an error that the agent ignores, while the final response still appears reasonable. The service stays up, so a health check shows nothing wrong. A trace shows where the tool call failed and how it affected the agent’s response.
Without tracing, students may know that their AI agent produced a wrong answer but struggle to explain why. Learning to inspect traces makes debugging more systematic and helps them test their fixes with confidence.
How Is AI Agent Observability Different From Monitoring?
Monitoring tracks system health, latency, and error rates. AI agent observability goes further by recording model calls, tool interactions, and retrieved data to help developers investigate incorrect outputs and failed actions.
A service can remain healthy while an AI agent returns an incorrect answer. Traditional monitoring may not reveal the cause, but traces and logs can help developers locate the faulty tool call, retrieval result, or model response.
| Feature | Traditional Monitoring | AI Agent Observability |
|---|---|---|
| Main Focus | System health and performance | Agent execution and decisions |
| Common Signals | CPU, memory, latency, and error rates | Model calls, tool results, retrievals, and trace spans |
| Typical Questions | Is the service slow or failing? | Where did the agent go wrong? |
| Failure Examples | Timeouts and service errors | Wrong tool use, irrelevant retrievals, and unsupported answers |
| Role | Detects abnormal behaviour | Helps investigate the cause |
For example, if a college enquiry chatbot responds slowly, its trace can help you identify whether the delay came from an API call, document retrieval, or another operation.
What Should You Monitor in AI Agent Observability?
When building an AI agent for a college project or portfolio, start by checking five things: whether its answers are correct, whether its tools work, how long it takes to respond, how many tokens it uses, and how much each task costs. These checks help you understand your agent’s behaviour and identify what needs improvement.
Step count can reveal inefficient behaviour. For example, a booking agent that usually completes a task in three steps might suddenly take twelve. It could be repeating tool calls, retrying failed actions, or getting stuck in a loop. Even if the final response looks correct, these extra steps can increase latency and token costs. Traces help pinpoint the repeated operations behind the increase.Understanding the key components of an AI agent, including tools, memory, and planning, can help you identify where these execution issues originate.
Performance metrics alone cannot establish whether an agent produces reliable results. Evaluate a sample of responses for accuracy and grounding. Accuracy checks whether an answer is correct, while grounding checks whether its claims are supported by retrieved information. An LLM-as-a-judge approach can automate some of these checks by using a second model to assess responses against defined criteria. Validate the judge’s scores against human-reviewed examples before relying on them at scale.
Visibility into these failures remains a challenge. Splunk’s 2026 State of Observability report highlights the gap between recognizing the importance of hallucination visibility and effectively achieving it. Teams should use these findings to assess their own monitoring gaps rather than assume that collecting metrics alone will reveal every issue.
Trace data also needs protection. Mask sensitive information, restrict access to trace dashboards, and define appropriate data-retention periods. Tools such as Microsoft Presidio can help detect and anonymize personal information before it enters logs or traces. Review the output carefully because automated detection may miss sensitive data.
How Do You Debug an AI Agent Using Observability?
Use this five-step process to debug an AI agent project. It helps you move from spotting an incorrect answer to finding the cause and checking whether your fix works.
- Find the first incorrect step. Open the failed trace and locate where the agent went wrong. For example, a college enquiry chatbot may retrieve an outdated course fee.
- Inspect the inputs and outputs. Check the retrieved document, model response, and tool result. Look for missing information, incorrect retrieval, or a failed API call.
- Fix the cause. Update the source document, adjust retrieval settings, or correct the tool logic based on what the trace reveals.
- Run the same test again. Send the original question to your agent and compare the new trace with the previous one. Check whether it retrieves and returns the correct fee.
- Save the test case. Record the original question, expected answer, and test result in a small dataset. Reuse it after code or prompt changes to check whether the same error returns.
By following this process, students can practise debugging AI applications systematically and explain how they identified and fixed a problem in their project.
Which Tools Help With LLM Observability?
The right LLM observability tool depends on your framework, tracing needs, and existing infrastructure. Some tools focus on debugging individual agent runs, while others connect AI traces with application and infrastructure monitoring.
LangSmith for tracing and evaluating agents is a practical option for teams using LangChain or LangGraph to trace model calls, inspect tool interactions, and evaluate agent runs.Arize Phoenix for open-source LLM observability offers an open-source option for tracing and evaluating LLM applications, making it useful for developers who want to experiment without starting with a paid platform.OpenLLMetry for OpenTelemetry-based LLM tracing instruments LLM applications using OpenTelemetry, helping developers send traces to compatible observability backends.
Teams that already monitor their applications and infrastructure may prefer an integrated platform.Datadog LLM Observability connects LLM application traces with performance and error data, while Dynatrace helps teams investigate AI application behaviour alongside broader application and infrastructure telemetry.
OpenTelemetry provides common APIs and conventions for collecting telemetry. This allows compatible tools to use the same instrumentation. It can reduce the work involved in switching observability backends. However, some tool-specific features may need adjustments. OpenTelemetry’s GenAI semantic conventions are still evolving. Check the current specification and your chosen tool’s support before implementing them.
Students starting with AI agent development can choose one observability tool that works with their framework. Build a small chatbot, trace its model calls and tool outputs, and investigate one failed response. This exercise helps you understand how tracing works before moving on to more complex AI projects.
| Follow Us for Daily Tech Tips |



|
How Can Jaipur Students Learn AI Agent Observability at TISA-TECH?
Students in Jaipur can build AI agent observability skills by progressing from Python fundamentals to Generative AI and practical agent development. TISA-TECH’s Python programming fundamentals covers programming and API fundamentals, while its Generative AI learning program introduces students to LLM applications and AI development concepts needed to build and debug agent-based projects.
As a practical project, students can build a customer support agent using Python and LangChain, then use Arize Phoenix to track its steps. The agent can answer customer questions using order details and help students find problems, such as a failed tool call or missing information. Students can also explore relevant internship opportunities in AI to learn how AI agent development and debugging techniques are used in real-world projects.
Learning path: Python basics → Generative AI and LangChain → Build a customer support agent → Track, debug, and test the agent.
Conclusion
AI agent observability helps you understand how an AI agent completes a task, identify why it fails, and verify whether a fix works. Tracing shows individual model calls and tool interactions, monitoring highlights changes in latency, errors, and cost, and evaluation checks whether the agent meets its expected results.
FAQs Section
Ans. Yes. Students and freshers can use observability to understand AI agent execution, debug failed tool calls, and test fixes. A small traced project also helps them demonstrate practical AI development skills.
Ans. Arize Phoenix is an open-source option for tracing and evaluating AI applications. LangSmith also offers a Developer plan with free usage subject to its current plan limits. Check the official pricing documentation for the latest trace allowances, included features, and additional-usage charges before choosing a tool.
Ans. Students who know basic Python can start tracing a simple AI agent within a few days. Learning to diagnose retrieval errors, debug tool calls, and evaluate results takes additional hands-on practice.
Ans. Observability helps explain how an agent executed a task, while evaluation measures whether its results meet defined criteria.
Ans. Yes. OpenTelemetry is free and open source, although some platforms used to store and analyze traces charge fees.