Glassdoor India lists more than 4,500 data analyst openings in September 2026. Look at the skills section of these jobs and you will see the same two names again and again. That is why almost every beginner faces the Power BI vs Tableau question in the very first week.
Jaipur businesses need the same skill. A jewellery exporter wants this festive season’s sales next to last year’s. A textile trader wants to see stock from three godowns in one place. A hotel group wants the occupancy of every property by Monday morning. All of them start with scattered spreadsheets. They need someone who can turn those files into one dashboard that a manager can understand in seconds.
That person is a data analyst, and the first big decision is which tool to learn. The short answer: pick Power BI if Excel feels familiar and you want more job openings. Pick Tableau if you enjoy exploring data through visuals. The sections below cover real prices, real limits, job demand in India, and which tool fits which kind of learner.

What Are Power BI and Tableau?
Think of two chefs who cook the same dish in two very different kitchens. Power BI and Tableau work exactly like that.
Microsoft makes Power BI. It works smoothly with Excel, Microsoft 365, Azure, and Microsoft Fabric. So if you already use Microsoft tools, you will feel at home quickly.
Salesforce owns Tableau. It puts visuals first. Drag a field onto the canvas, add a filter, and the chart changes instantly. Both tools rank among the most popular business intelligence tools, and both can connect to data, clean it, and publish dashboards. The real differences show up after a few hours of use.
Power BI vs Tableau: What is the Main Difference?
Power BI and Tableau look alike on the screen, but they think in opposite ways.
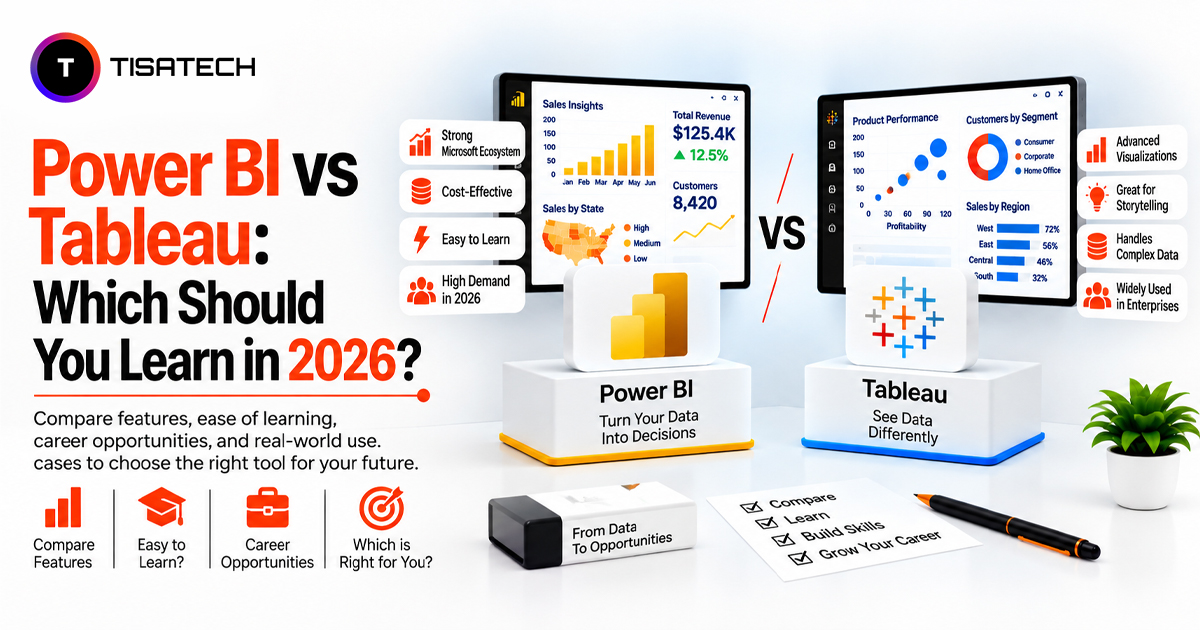
Let’s compare Power BI and Tableau side by side.
| Factor | Power BI | Tableau |
|---|---|---|
| Owner | Microsoft | Salesforce |
| Core focus | Modeling, analysis, and business reporting | Visual analysis and data exploration |
| Data modeling | Strong (DAX formulas, table relationships) | Flexible calculated fields |
| Beginner experience | Familiar to Excel users | Easy drag-and-drop visuals |
| Runs on | Windows only (Desktop) | Windows and Mac |
| Free option | Power BI Desktop | Tableau Desktop Public Edition |
Power BI thinks like a spreadsheet, while Tableau thinks like a canvas.
Power BI vs Tableau: Which is Easier to Learn?
If you use Excel, you already have a head start with Power BI. Its Power Query tool lets you clean data through simple steps such as filtering, splitting columns, and joining tables. Most beginners can get comfortable with these basics within a couple of weeks. DAX, Power BI’s formula language, takes more practice, especially for advanced calculations.
Tableau is a good option if you want quick visual results. Drag a field onto the screen, create a chart, and see the result within minutes. It gets more challenging later when you start using calculated fields and Level of Detail expressions.
What the First Month Looks Like
Power BI:
- Week 1: Importing and cleaning data
- Week 2: Connecting tables
- Weeks 3–4: Creating measures and building a dashboard
Tableau:
- Week 1: Creating charts and using filters
- Week 2: Building dashboards and adding interactivity
- Month 2: Moving into advanced calculations
So, Power BI may feel more familiar to Excel users, while Tableau can feel easier if you prefer visual learning.
Data Preparation and Modeling: Power BI vs Tableau
Imagine a sales table, a product table, and a branch table that need to work together. Power BI handles this well. Power Query cleans the data, relationships connect the tables, and DAX adds calculations that you can reuse across charts.
Take the jewellery exporter who wants to compare this festive season’s sales with last year’s. One DAX measure using time-intelligence functions can give that comparison across regions, products, and charts. Create it once, and you can use it everywhere. A date table is also important because these functions depend on it.
DAX can feel difficult at first, but it saves time as projects get bigger.
Tableau takes a simpler approach. It connects tables through relationships, while calculated fields provide quick answers. However, the same calculations may need to be recreated across different workbooks or data sources. Level of Detail expressions are powerful for advanced calculations, but they take practice to understand.
For projects with many tables, such as sales, inventory, or finance, Power BI can be a more practical choice.
Which Tool is Better for Data Visualization?
Tableau gives you more visual freedom. Almost every part of a chart can be changed, from the layout to how viewers interact with it. This helps when you want to tell a story, like in an interactive client dashboard.
Power BI is more practical. It builds clean dashboards for sales reports, finance tracking, and KPI screens, where a consistent look matters more than style.
AI assistants add one more difference in 2026. Copilot in Power BI needs a paid Fabric capacity of F2 or higher, and a Pro license alone will not turn it on. On the Tableau side, Tableau Pulse comes with paid Tableau Cloud editions, while Tableau Agent is available only in the top Tableau+ tier. Free learner setups do not include any of these.
How Much Do Power BI and Tableau Actually Cost in 2026?
Power BI Desktop is free for building reports on one computer. The cost starts when you share reports, because publishing to colleagues needs a Power BI Pro license at $14 per user per month.
Tableau also has a free and a paid side. Tableau Desktop Public Edition is free, and Tableau’s student page points learners to it. But there is one catch: everything you publish goes to Tableau Public, so every workbook is visible to everyone. Paid Creator seats start at $75 per user per month on the Standard edition and go up to $115 on Enterprise, so always ask which edition a quote covers.
Here is a small team example. Five analysts on Power BI Pro cost $70 a month, while five Tableau Creators on Standard cost $375.
For learning, price rarely decides anything, because both free options cover what a student needs.
Power BI vs Tableau Jobs in India: Where Do Companies Use Each in 2026?
Power BI is used in finance, sales, and operations teams that need regular reports, especially where Microsoft 365 is already in use. It is the usual choice when a manager needs a dashboard fast.
Tableau is used where the analysis itself matters more. Consulting firms, product teams studying user behavior, marketing teams digging into campaign data, and companies that use Salesforce a lot all prefer it.
Job listings show the same split. If you search for each tool on Naukri or LinkedIn in Jaipur, you will usually see more Power BI openings, mainly because so many employers already pay for Microsoft 365. Tableau openings exist too, but fewer, mostly at product companies, consulting firms, and remote roles. Run both searches on the same day and compare the counts.
Fresher analyst offers in India commonly start between ₹3.5 LPA and ₹6 LPA, and strong project portfolios in metro cities can push offers higher. Neither tool guarantees a salary, because the city, the company, and what you can do with the tool all decide the number.
Whichever tool you choose, add SQL early. Most analyst job posts list SQL and Excel along with Power BI or Tableau, so the tool alone rarely gets you the interview. If you want the bigger picture, you can also explore different types of AI courses to do in 2026 to see how data science, machine learning, and generative AI connect with analytics.
Do Power BI or Tableau Certifications Matter for Your Career?
Power BI has the PL-300 exam, called Microsoft Certified: Power BI Data Analyst Associate. It covers data preparation, modeling, visualization, and report deployment, and Microsoft publishes an official PL-300 study guide. The certification is valid for one year, and a free online assessment renews it.
Tableau’s closest option is Tableau Certified Data Analyst, which focuses on analysis and visualization. The exam fee is $250, and the certification is valid for two years.
Now picture the interview. The panel asks how a measure works, and you open a dashboard you built yourself. That moment beats any line on a resume. A certificate proves you know the basics. Projects prove your skill.
Portfolios work differently in each tool. Tableau Public gives you a link that a recruiter can open in one click. Power BI portfolios usually rely on screenshots, screen recordings, and a file on GitHub, because sharing live reports needs a paid license.





How TISA-TECH Can Help You Learn Power BI or Tableau Faster
TISA-TECH’s Data Analytics training in Jaipur helps you learn faster by putting you on practical datasets from day one. The course starts with Excel formulas and pivot tables, moves to SQL queries, KPI dashboards, and Power BI, and ends with a real analytics case that students present.
The Power BI module covers data import, relationships, star schema, measures, and a published business dashboard. Tableau is taught through the data science track, which covers visualization in both tools. Mentor-led project reviews show you exactly where a dashboard confuses viewers, which is feedback that video tutorials never give.
Placement support then helps you turn finished dashboards into interview conversations.
Conclusion
The right choice depends on which kind of analyst you want to become first.
Choose Power BI if Excel already feels like home, you use a Windows laptop, and you want more interview calls. Its reporting strengths match what many Indian employers ask for.
Choose Tableau if you enjoy visual exploration more than formulas, if you use a MacBook, or if you want to join a consulting, product, or Salesforce-heavy team.
Skip the endless comparison videos. Pick one tool, build three real projects with it, and the second tool will take you much less time.
FAQs Section
Ans. Power BI suits most job seekers in India, since more job listings ask for it and it works well with Excel. Tableau is a better fit if you love visual storytelling.
Ans. Yes, for building reports on a single computer with Power BI Desktop. To share reports with other people, you need a paid Pro license.
Ans. Power BI Desktop has no Mac version, so Mac users need a Windows virtual machine or the browser service. Tableau Desktop can be installed on a Mac directly.
Ans. No, neither needs traditional coding at the start. DAX in Power BI and calculated fields in Tableau matter only for advanced work.